Open any Facebook Ads Manager dashboard and you’ll see a wall of green arrows. CTR up. Impressions up. Reach up. Engagement up. Everything looks like it’s working — and that’s exactly the problem. Facebook’s reporting UI is optimized to make campaigns look healthy, not to tell you whether they’re profitable. Those aren’t the same thing, and confusing them is the single most common mistake in ads analysis.
This guide walks through which Meta metrics are cosmetic, which ones actually correlate with revenue, and how to build a reading habit that catches problems before they burn budget.
Quick Answer
Good Facebook ads analysis means ignoring metrics that measure attention (CTR, reach, engagement, video views) in isolation and instead tracing every number down to cost per result and marginal ROAS at your actual spend level. A campaign can have excellent CTR and reach and still lose money if the traffic doesn’t convert or the cost per acquisition exceeds your margin. The fix: always pair a top-of-funnel metric with a bottom-of-funnel one before drawing a conclusion, and check trend direction over at least 5-7 days before acting — Meta’s daily numbers are noisy and attribution windows shift retroactively.
What Counts as a Vanity Metric in Facebook Ads Reporting?
A vanity metric is any number that goes up without a reliable link to revenue. On Meta, the usual suspects are:
- CTR (link click-through rate) — measures ad relevance to the algorithm, not purchase intent. High CTR from a misleading hook often converts worse than a plainer, more honest ad.
- Reach and impressions — tell you delivery volume, not quality. A campaign can reach a million people and sell nothing if targeting is loose.
- Engagement (likes, comments, shares) — correlates with content that performs well organically, which is frequently the opposite of content that drives direct response.
- Video views (3-second or ThruPlay) — measures whether the hook worked for three seconds, not whether anyone remembered the brand or bought anything.
- Cost per click (CPC) — cheap clicks from broad, low-intent audiences will always beat cheap clicks from a warm retargeting list, but the second group converts at a completely different rate.
None of these are useless — they’re diagnostic, not decisive. The mistake is treating them as proof of performance instead of as inputs into a deeper read.
Which Facebook Metrics Actually Predict Profitability?
The metrics that matter are the ones tied to the outcome you’re actually paying for:
- Cost per purchase / cost per lead (CPA) — the real unit economics question: does this cost less than what the customer is worth?
- ROAS at the ad set level, not the campaign level — campaign-level ROAS hides winners subsidizing losers. Always drill down.
- Marginal ROAS as spend increases — the ROAS on your first $100/day and your five hundredth are different. Facebook’s aggregate number blends both.
- Conversion rate from landing page view to purchase — isolates whether the problem is the ad or the destination.
- New customer vs. existing customer breakdown — a campaign can show strong ROAS while mostly re-selling to people who would have bought anyway.
- Post-purchase or LTV-adjusted CPA, if you have it — the single best predictor of whether scaling a campaign will scale profit or just spend.
This is the core discipline of facebook advertising analytics: every vanity metric needs a matching efficiency metric before you’re allowed to call a campaign “working.”
Why Does CTR Go Up While Sales Go Down?
This is one of the most common false signals in facebook ads analytics, and it usually comes from one of three causes:
- Creative fatigue disguised as a hook problem. A new creative gets a CTR spike because it’s novel, not because it’s more persuasive. The algorithm rewards the click, then the landing page fails to convert the traffic because the ad over-promised.
- Audience dilution. Broadening an audience (or letting Advantage+ expand it) increases volume and often nudges CTR because of algorithmic optimization toward click-likely users — while pulling in people further from a buying decision.
- Attribution timing mismatch. Facebook’s reported conversions update retroactively within the attribution window. A CTR spike today paired with a sales dip could just mean today’s conversions haven’t attributed yet.
The fix in your ads analysis workflow is simple: never read CTR and conversion rate on the same day in isolation. Look at the relationship over a rolling week and check whether cost per purchase moved in the same direction as CTR or against it.
How Should You Read ROAS Without Getting Misled?
ROAS is the most abused number in Meta reporting because it’s a single figure standing in for a much more complicated picture. Three adjustments matter:
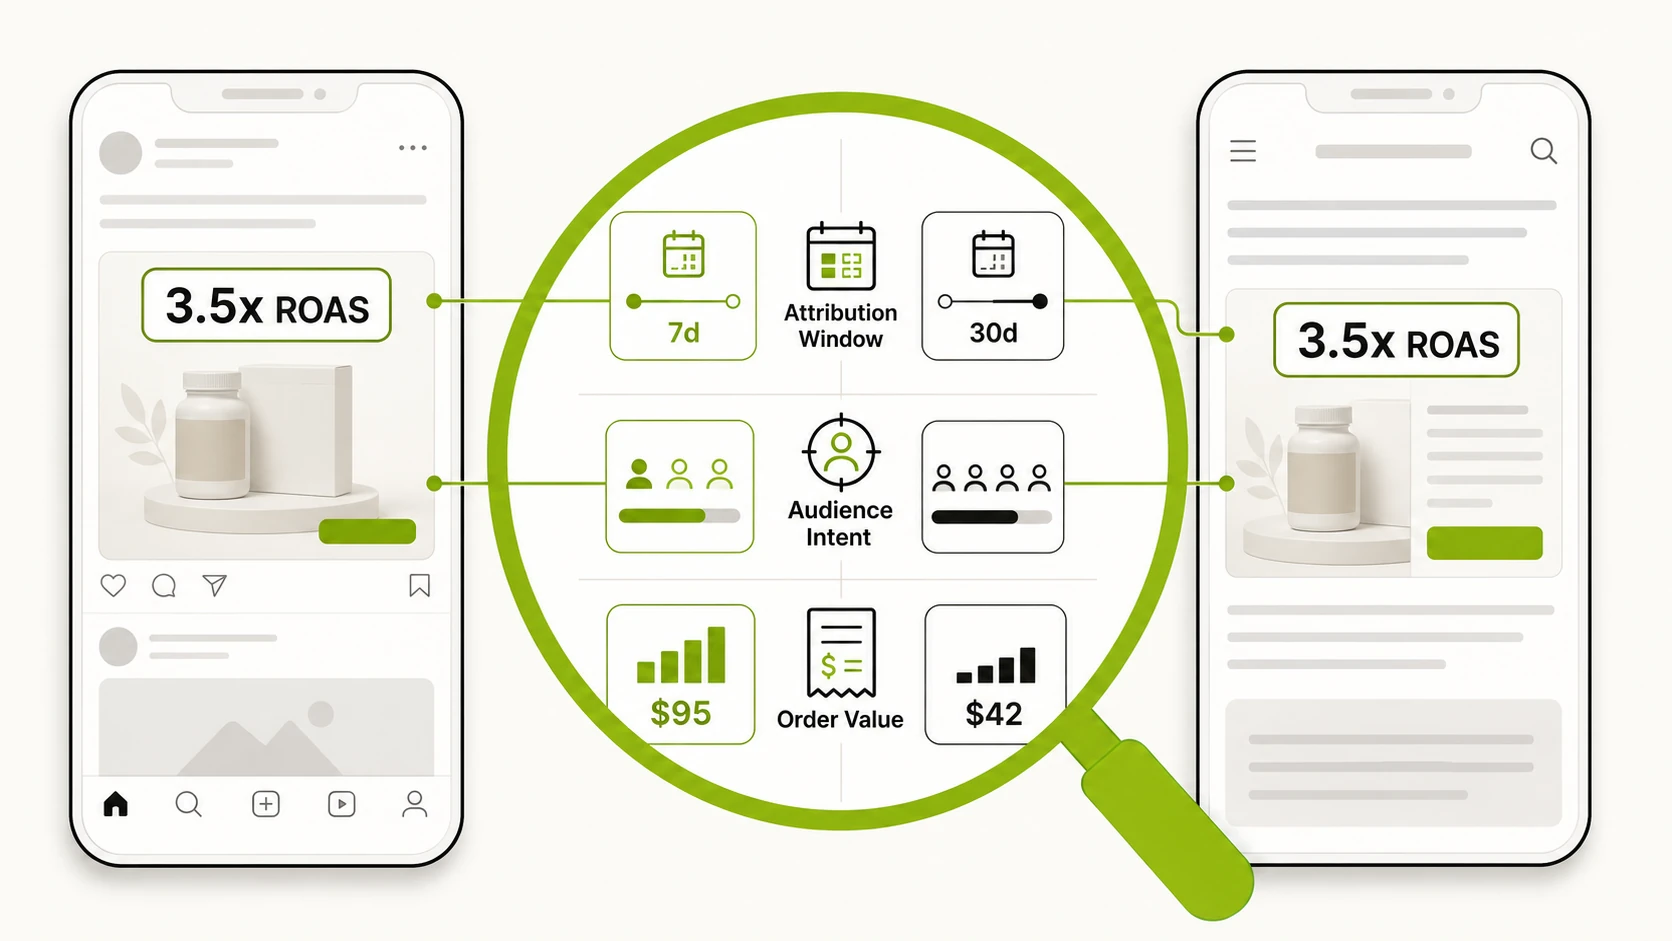
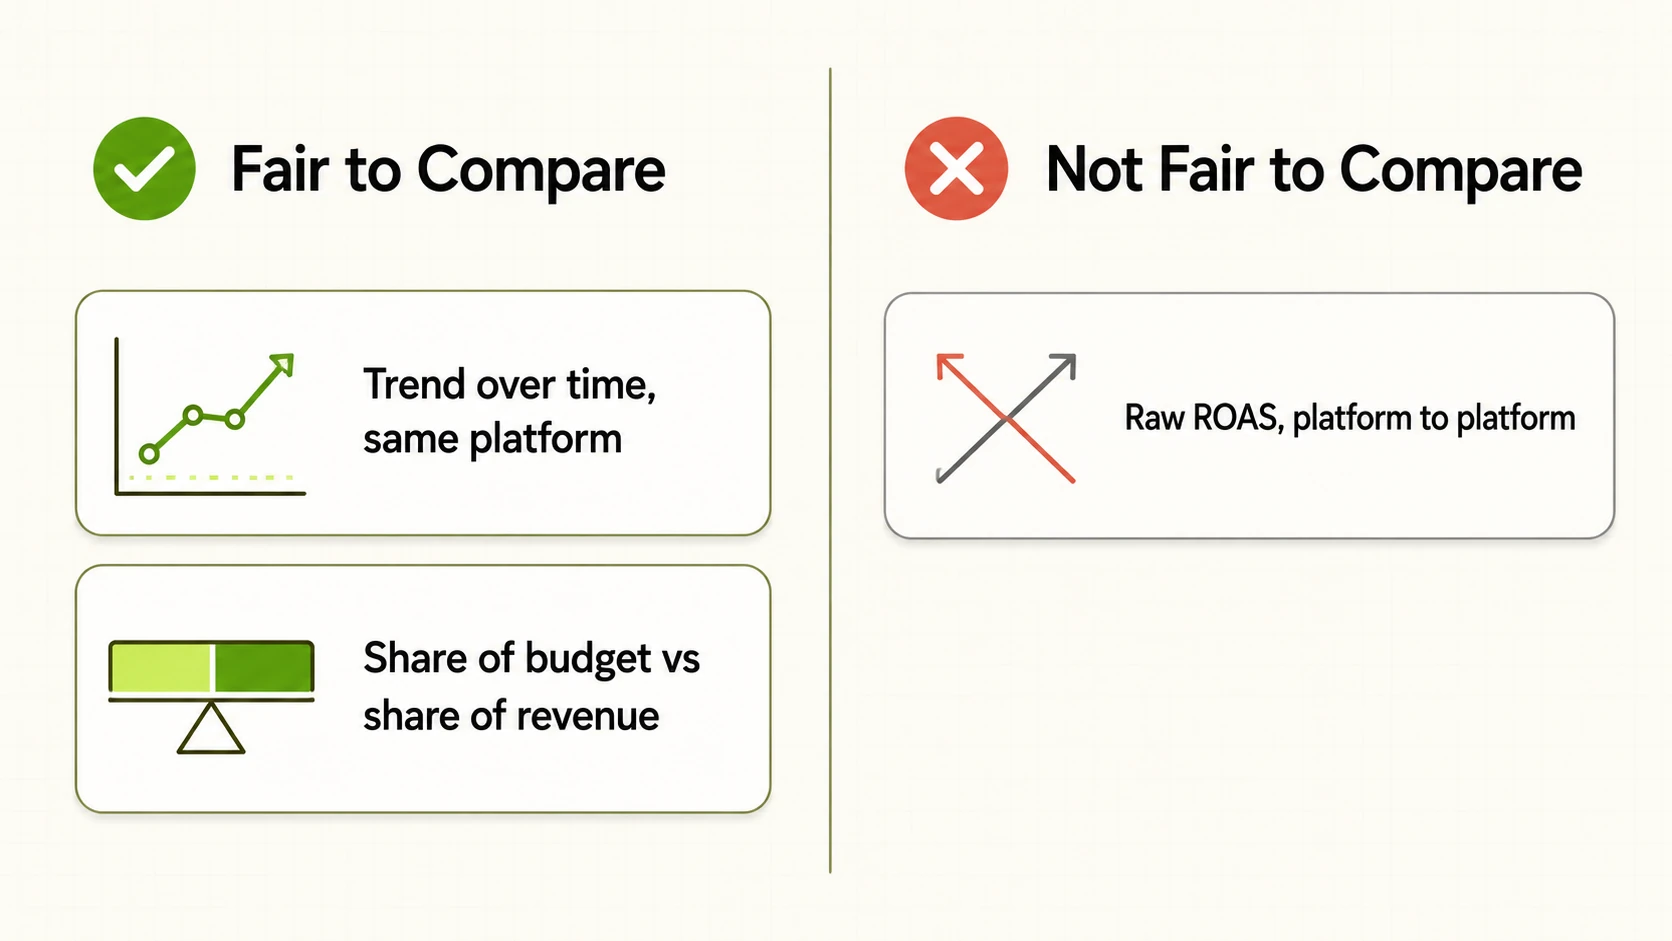
- Blended vs. platform-reported ROAS. Meta’s attribution (especially with modeled conversions post-iOS 14.5) tends to over-credit itself. Compare it against blended ROAS from your actual revenue and total ad spend across channels, and treat the gap as your discount factor.
- Attribution window choice changes the number, not the reality. A 7-day click / 1-day view window will show a different ROAS than 1-day click only — for the same campaign, same spend, same sales. Pick one window and stay consistent, or the metric isn’t comparable week to week.
- Break-even ROAS is a moving target. It depends on margin, not on a round number like “3x is good.” A campaign at 2.2x ROAS can be more profitable than one at 4x if the margin structure is different. Calculate your actual break-even before judging any ROAS figure.
What’s the Right Way to Read Frequency and Reach Together?
Frequency (average times a person sees your ad) means nothing on its own — it only means something paired with performance direction:
- Rising frequency + stable or improving CPA = audience hasn’t saturated, creative is holding.
- Rising frequency + rising CPA = creative fatigue or audience exhaustion — refresh creative or expand audience before adding budget.
- Low frequency + poor CPA = the problem isn’t wear-out, it’s targeting or offer, and more spend won’t fix it.
Reading frequency in isolation is how teams either kill a campaign too early (mistaking normal frequency growth for fatigue) or keep pouring budget into an audience that’s already tapped out.
How Do You Spot a Campaign That’s Winning on Paper but Losing Money?
Run this check before scaling anything:
- Pull cost per purchase at the ad set level, not campaign level.
- Subtract product cost, fulfillment, and payment processing from revenue per order to get contribution margin.
- Compare contribution margin per order against cost per purchase. If CPA is close to or above contribution margin, the campaign is a net loss regardless of what ROAS says.
- Check the new-vs-returning customer split. A campaign heavy on retargeting existing customers will show great numbers while adding little incremental revenue.
- Check whether “purchases” includes low-value SKUs skewing volume up while revenue per purchase falls — a rising conversion count paired with falling average order value is a red flag, not a win.
This is where most vanity-metric mistakes get made: a campaign clears every dashboard threshold (CTR fine, ROAS above 1, conversions climbing) and still erodes margin because nobody checked contribution economics against CPA.
What’s a Practical Weekly Ads Analysis Checklist?
- Pull ad-set-level ROAS and CPA, not campaign-level averages.
- Compare this week’s CPA trend against a 4-week rolling average, not just day-over-day.
- Segment new vs. returning customers before judging any ROAS number.
- Check frequency against CPA direction, not frequency alone.
- Reconcile Meta-reported conversions against your actual order data — track the delta, not just the absolute number.
- Flag any campaign where CTR or engagement improved but CPA worsened — that’s the clearest vanity-metric trap.
- Only scale budget on campaigns where marginal ROAS (not just aggregate ROAS) clears your break-even line.
Vanity Metric vs. Metric That Matters
| Vanity metric | What it actually tells you | Metric that matters instead | Why it’s more reliable |
|---|---|---|---|
| CTR | Ad grabbed attention or triggered a click-prone audience | Landing page conversion rate | Shows whether the click turned into revenue |
| Reach / impressions | Delivery volume | Cost per purchase | Ties spend to outcome, not exposure |
| Engagement (likes, comments) | Organic resonance | New customer ROAS | Separates brand goodwill from sales impact |
| Video views / ThruPlay | Hook worked for 3 seconds | Post-view conversion rate | Confirms the view led somewhere |
| Campaign-level ROAS | Blended average across all ad sets | Ad-set-level marginal ROAS | Reveals winners hidden behind losers |
| CPC | Cheapness of traffic | Cost per purchase | Cheap traffic that doesn’t convert is expensive traffic |
| Total conversions | Volume | Contribution margin per order minus CPA | Confirms the campaign is profitable, not just active |
FAQ
What’s the difference between vanity metrics and performance metrics in Facebook Ads Manager?
Vanity metrics (CTR, reach, engagement, video views) measure attention and delivery. Performance metrics (CPA, marginal ROAS, contribution margin per order) measure whether that attention converted into profitable revenue. Every vanity metric needs a paired performance metric before it means anything in your ads analysis.
Why does Meta’s reported ROAS differ from my actual revenue?
Meta attributes conversions using its own modeling, which since iOS 14.5’s tracking changes tends to include modeled/estimated conversions alongside directly observed ones. It also depends heavily on your chosen attribution window. Always compare it against blended ROAS calculated from real order data to know your true gap.
How often should I check facebook ads analytics to avoid overreacting to noise?
Daily monitoring is fine for catching delivery issues (an ad set stuck in “learning limited,” a sudden spend spike), but conversion and ROAS conclusions should be drawn on a rolling 5-7 day view minimum. Attribution data updates retroactively, so same-day reads are frequently wrong.
Is a high frequency always a sign of ad fatigue?
No. Frequency only signals fatigue when it rises alongside a worsening CPA or falling CTR. Stable performance at rising frequency usually means the audience and creative still have room; the number alone doesn’t diagnose anything.
What’s the fastest way to catch a vanity-metric trap in an existing campaign?
Pull ad-set-level CPA next to contribution margin per order. If a campaign clears every top-line metric (CTR, ROAS, conversion count) but CPA is close to or above margin, it’s a vanity-metric trap regardless of what the dashboard summary says.
Do these fb ad analytics principles apply the same way to Advantage+ campaigns?
Yes, arguably more so. Advantage+ automates targeting and placement decisions, which means the metrics you can control shift toward creative and offer. The need to check marginal ROAS and new-customer split before scaling is even more important, since you have less visibility into which audience segment is driving a given result.
Getting Clean Numbers in the First Place
Most vanity-metric mistakes are reporting friction failures, not analytical ones. Pulling ad-set-level CPA, contribution margin, and new-customer splits across multiple accounts by hand takes too long to do every week, so teams default to the top-line dashboard instead.
FabFunnel’s Multi Ad Account Reporting syncs spend, ROAS, CPR, CTR, and CPC across accounts roughly every 15 minutes, so the numbers you’re reading down to the ad-set level are current, not a stale end-of-day pull. Co-Pilot surfaces recommendations against that live data — it doesn’t execute changes automatically, so the calls in this piece (is this ROAS real, is this frequency a problem) stay with you. If you run rules against CPA floors or ROAS thresholds, the Automation Rules Engine logs every automated action with the triggering condition and timestamp, making it easier to audit whether a rule reacted to signal or noise.
None of that replaces the reading discipline above — it just removes the friction that makes teams skip it.
Analyze Meta, TikTok & NewsBreak in One Place
FabFunnel connects performance reporting across Meta, TikTok, and NewsBreak, giving teams one place to monitor ROAS, CPA, CTR, spend, impressions, and clicks across connected accounts.
Explore Multi Ad Account Reporting to bring cross-platform performance data into one dashboard, or see how FabFunnel Automation can apply CPA and ROAS rules across Meta, TikTok, and NewsBreak.