Quick Answer: AI marketing analytics dashboards mislead teams when attribution models overcount one channel, blended metrics hide platform-specific problems, AI summaries state confident conclusions from incomplete data, or delayed data gets labeled real-time. The fix is not a better dashboard. It is checking the raw numbers behind every automated conclusion before you act on it.
Why AI Marketing Analytics Dashboards Get It Wrong
Most teams do not lose money because their analytics tool is broken. They lose money because the tool works as designed and nobody asks what “designed” means for their specific setup. A dashboard is a summarization layer on top of raw event data, and summarization involves choices: which touchpoint gets credit, which timezone counts as today, which metrics get averaged together. Each choice can be defensible in general and still wrong for the decision a marketer is about to make.
These mistakes are not edge cases. They show up in ordinary reporting cycles and rarely announce themselves, a pattern common wherever ai in marketing analytics runs unchecked. The dashboard does not flash a warning when it is confidently wrong, which is the core limitation of any marketing analytics ai system. It just reports a number, and the number looks fine.
Attribution Model Mismatches Inflate One Channel’s Contribution
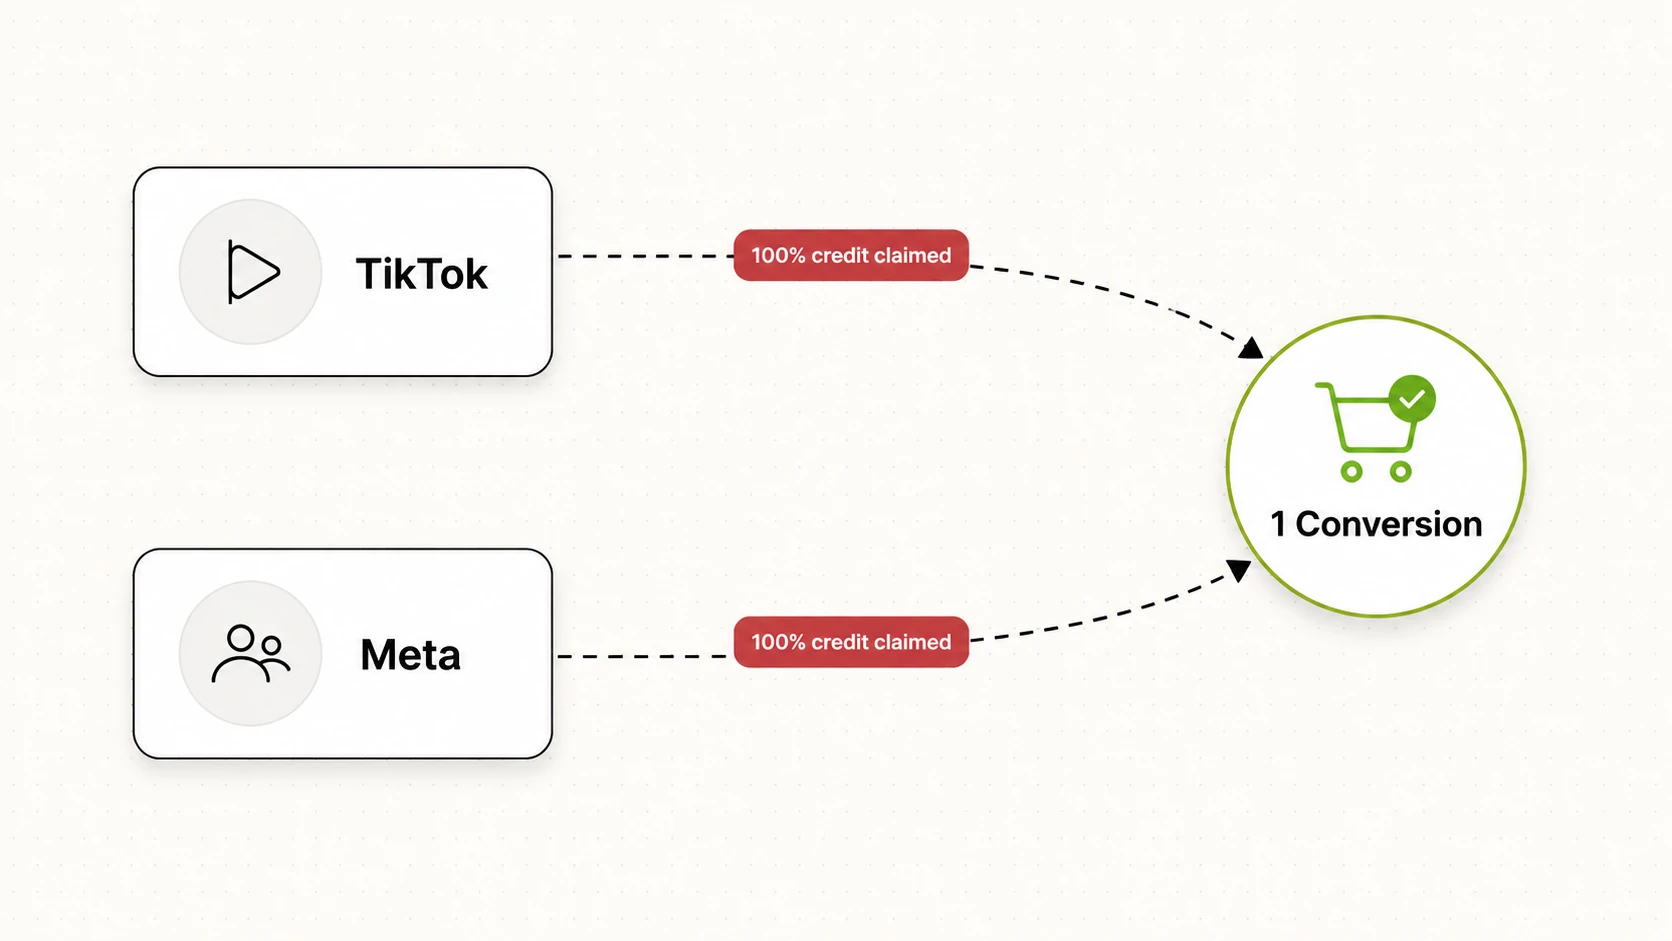
Most ad platforms default to a last-click or a 7-day click, 1-day view attribution window. If a prospect saw a TikTok ad, ignored it, then clicked a Meta retargeting ad three days later and converted, both platforms may claim credit under their own logic. Neither sees the other’s touchpoint, so neither discounts its own number. Add a third channel and the double-counting compounds.
This turns into a budget problem when a team looks at blended ROAS by channel, concludes retargeting is outperforming prospecting, and shifts spend accordingly. Retargeting is not necessarily more efficient. It sits closer to the purchase, and attribution windows favor recency. Cutting prospecting spend on that read starves the funnel feeding those retargeting numbers, and the effect does not show up for two or three weeks, by which point it looks like an unrelated problem.
The check: pull the same conversion window and comparison period across every connected platform before comparing channel performance, and treat any attribution-driven conclusion as directional until you have checked the raw conversion paths.
Blended Metrics Hide Platform-Specific Problems
A combined view across Meta, TikTok, and NewsBreak is useful for a fast pulse check on total spend and ROAS. It is also where platform-specific problems hide. If NewsBreak CPCs quietly double while Meta CPCs stay flat, and Meta carries most of the spend, the blended CPC barely moves. A team scanning the top-line number sees nothing alarming and moves on.
The same masking happens with CTR and CPR. A creative dying on TikTok can be propped up in the blended average by a Meta campaign running well that week. The dashboard is not wrong, it is doing exactly what a blended metric is supposed to do. The mistake is treating an averaged number as if it tells you where to act.
The check: never make a platform-level decision from a blended number. Drop into the per-platform view before pausing, scaling, or reallocating anything, and scan each connected account individually at least once a week.
An AI Summary States a Wrong Conclusion Because the Data Had a Gap
AI-generated insight summaries, the product of machine learning in marketing analytics pipelines, are built to produce a clean, confident sentence. They are not built to flag uncertainty when the underlying data is incomplete, because most systems built on machine learning for marketing analytics have no way to represent that uncertainty. If a pixel misfires for six hours, an ad account disconnects and reconnects, or an API sync fails silently for a day, the summary layer does not know a gap exists. It describes whatever data arrived as if it were complete.
The result reads like this: “Ad Set B’s CPA improved 40 percent this week.” What actually happened is a tracking break dropped a batch of low-quality conversions from the count, so the average looked better purely because the denominator shrank. Nobody fabricated the sentence. The layer summarized what was in front of it, and what was in front of it was wrong.
The check: any summary reporting a sudden, sharp improvement or decline deserves a look at the underlying event volume for that period, not just the headline metric. An improved CPA paired with a matching drop in total conversions or spend is a data problem dressed up as a win.
Teams Trust an Automated Insight Without Checking the Raw Numbers
This is less a technical failure than an operating habit. Once a team gets used to a tool producing accurate reads most of the time, the natural response is to stop double-checking it. That instinct is also the exact condition under which a wrong conclusion does the most damage, because nobody catches it before the budget call gets made.
Teams that avoid this do not distrust their tools. They keep a short habit: before a meaningful budget shift, someone opens the raw ad-set or campaign numbers behind the recommendation and confirms the trend holds at that level. It takes a few minutes. Skipping it is what turns a data gap or an attribution quirk into a real budget mistake.
Stale or Delayed Data Presented as Real-Time
Ad platforms rarely deliver perfectly fresh data. Meta’s reported numbers can shift for up to 72 hours after a conversion as attribution windows close and delayed conversions get logged. If a dashboard displays yesterday’s numbers as final at 9 a.m. without flagging that they are still settling, a team can act on figures that will look different by end of day.
This gets worse with sync delays. If a connected account has not refreshed in several hours because of an API hiccup, and the dashboard does not clearly timestamp the last successful sync, the numbers on screen can be hours old while looking current. A campaign that appears to be underperforming right now might just be behind on reporting, not behind on delivery.
The check: know what “as of” time the dashboard is actually showing, treat the most recent 24 to 48 hours of any platform’s data as provisional, and confirm the last sync timestamp before reacting to an unusual same-day number.
Dashboard Says, What’s Actually Happening, How to Check
A table is warranted here because these five mistakes share the same shape: a number on screen, a hidden cause, and a specific action to confirm it. Laying them side by side makes the pattern easier to spot than five separate paragraphs would.
| Dashboard says | What’s actually happening | How to check |
|---|---|---|
| Retargeting has 3x the ROAS of prospecting | Attribution windows favor the last click closest to purchase | Compare conversion paths, not just channel-level ROAS, across the same period |
| Blended CPC is flat week over week | One platform’s CPC doubled while another stayed flat and absorbed the average | View each connected account separately, not just the combined total |
| CPA improved 40 percent this week | A tracking gap removed a batch of conversions from the count | Check total conversion volume and spend alongside the CPA figure |
| Ad Set B is underperforming right now | The account has not synced in several hours | Check the last sync timestamp before acting on same-day numbers |
| This week’s numbers are final | Platforms can still revise conversions up to 72 hours later | Treat the most recent one to two days of data as provisional |
What to Check Regardless of Which Tool You Use
None of this is specific to one platform. Every analytics tool, including FabFunnel’s, runs on the same constraint: it can only summarize the data it receives, and it cannot independently verify that the data is complete, correctly attributed, or fully settled. Consolidated reporting shows what happened across accounts in one place. It does not replace the analysis of why something happened, and it does not make the strategic call on what to do next. That part stays with the person reading the numbers.
FabFunnel’s Multi Ad Account Reporting syncs spend, ROAS, CPR, CPC, and CTR roughly every 15 minutes across every connected Meta, TikTok, and NewsBreak account into one dashboard, with timezone selection so teams are not comparing numbers logged in different clocks. This kind of cross-account visibility is part of what FabFunnel’s ai ad management platform covers. Co-Pilot, FabFunnel’s natural-language assistant, is trained on live account data and can flag underperforming ad sets or build a report on request, but it is built to give a second read before a budget call, not to replace a check against raw numbers. Recommendations stay visible on the dashboard rather than disappearing into a one-off chat, so a team can come back and verify them against the account data.
The habit that protects a budget is the same regardless of which tool sits in front of you: pull the raw numbers behind any automated insight before a meaningful decision, check platform-level data before trusting a blended figure, and know how fresh the data on screen actually is.
FAQs
1. Why does my AI marketing analytics dashboard show different ROAS numbers than the ad platform itself?
Different tools apply different attribution windows and conversion counting rules than the native ad platform. A dashboard using a 7-day click window reports different totals than a platform reporting on a 1-day view window, even from the same account. Neither number is wrong on its own, they answer slightly different questions.
2. How do I know if my dashboard data is real-time or delayed?
Check whether the tool displays a last-synced timestamp next to the data, not just a generic “updated today” label. If there is no visible sync time, treat same-day figures as provisional and confirm them against the native ad platform before deciding anything.
3. Can attribution overlap between platforms actually change my budget decisions?
Yes, it is one of the more common causes of misallocated spend. When two platforms both claim credit for the same conversion, whichever channel sits closer to the purchase tends to look artificially efficient, which can lead a team to cut prospecting budget that was feeding those later conversions.
4. Why did my cost per result suddenly improve without any changes to the campaign?
A sudden, unexplained improvement in cost metrics is worth checking against total conversion volume and spend for the same period. If both dropped alongside the improved average, a tracking break or partial data sync is a more likely explanation than an actual performance gain.
5. Is blended reporting across multiple ad platforms still useful if it can hide problems?
It is useful for a quick pulse check on total spend and overall direction, but it should not be the basis for platform-level decisions. Pair any blended view with checking each connected account individually before scaling, pausing, or shifting budget on a specific platform.
6. Does FabFunnel’s Co-Pilot replace the need to check raw numbers myself?
No. Co-Pilot gives a second read on account performance and flags underperforming ad sets before a budget call, with recommendations staying visible on the dashboard so they can be checked against the underlying data. It is not a substitute for that check.
Check the numbers behind the summary before your next budget call. Start at FabFunnel or read more.