Most media buyers track too many metrics and act on too few.
The Facebook ads analytics dashboard serves up dozens of data points per campaign. The teams that scale effectively aren’t the ones tracking all of them – they’re the ones who know which five or six metrics actually tell them what to do next, and they check those consistently.
This guide covers the metrics that matter in Facebook advertising analytics in 2026, why each one is worth tracking, and what it should be telling you about campaign performance.
Why Facebook Ads Analytics Is More Complex in 2026
Two things have made facebook ads analytics harder to read in recent years: iOS privacy changes and Meta’s shift toward algorithmic campaign structures.
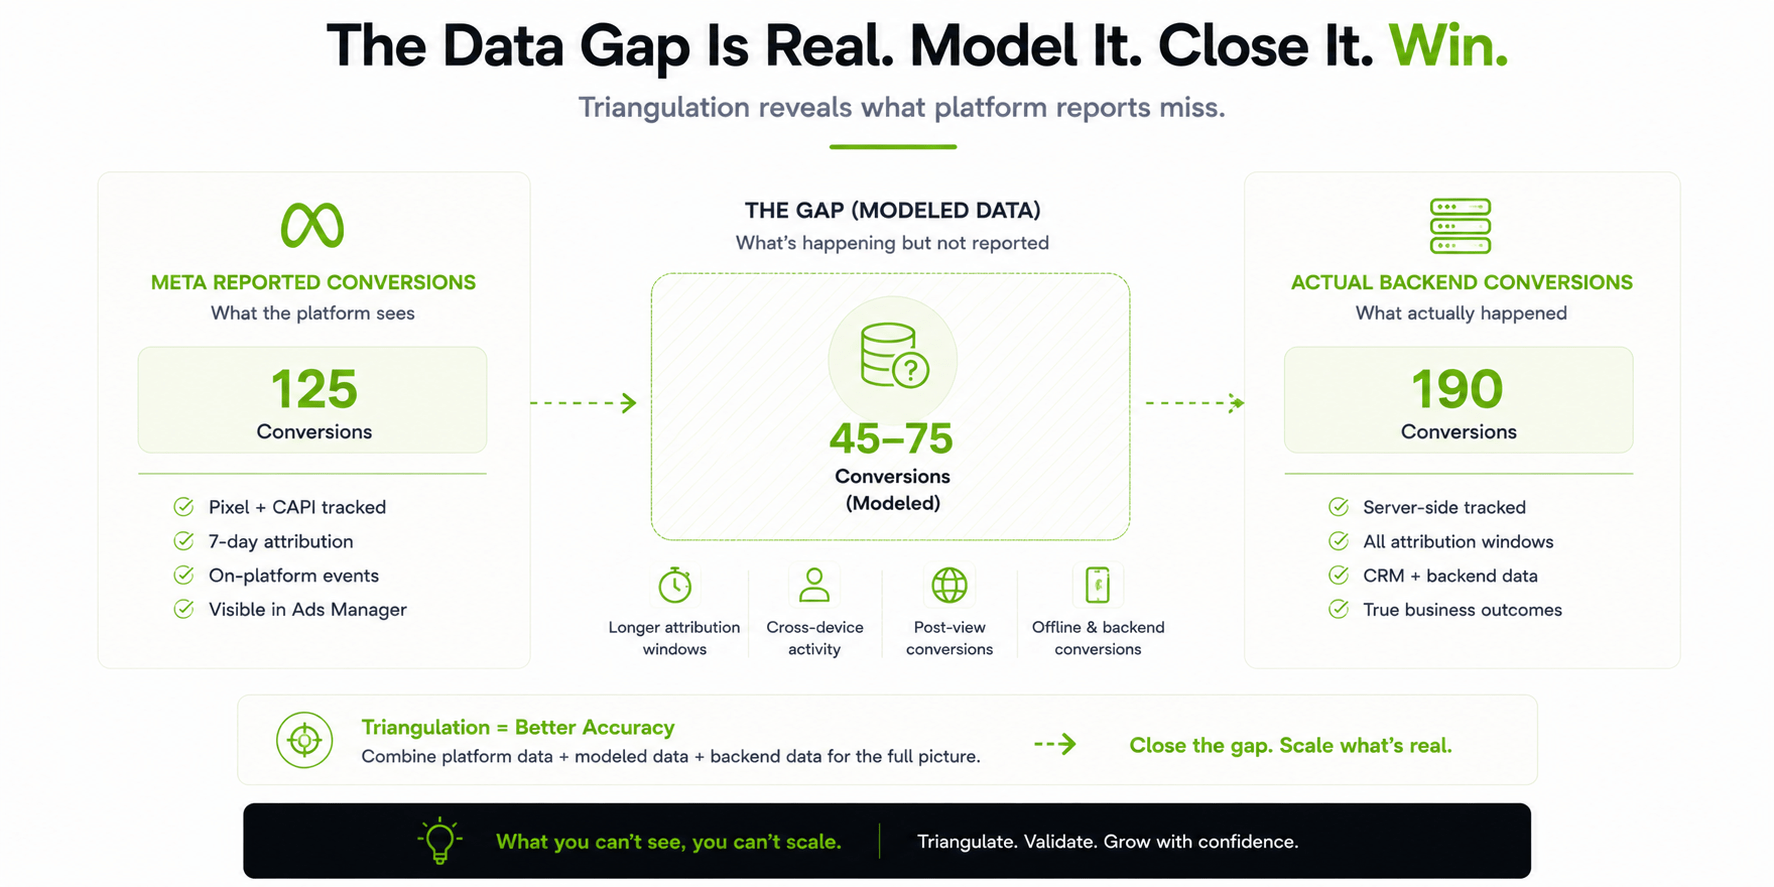
iOS 14.5 and subsequent updates reduced the availability of individual user tracking data. Meta’s reported conversions now include modeled data – statistical estimates filling in where tracking gaps exist. The number you see in Ads Manager for purchases or leads is no longer a direct count. It’s a mix of confirmed conversions and modeled ones.
This doesn’t make the data useless. It means you need to triangulate – comparing Meta’s reported data with your backend (Shopify, your CRM, your payment processor) to understand the actual conversion volume and make budget decisions from numbers you trust.
The shift to Performance Max and Advantage+ campaign structures has also reduced the granularity of campaign-level data. More of the targeting and placement decisions happen inside Meta’s algorithm, which means less breakout data per audience or placement – and more reliance on creative-level performance signals as the primary optimization lever.
The Core Metrics That Actually Drive Decisions
Cost Per Result (CPR)
This is the primary performance metric. Whatever your campaign objective – purchase, lead, add to cart – cost per result tells you what you’re paying to achieve it.
Track CPR at the ad set and ad level, not just the campaign level. Campaign-level CPR averages across ad sets that may be performing very differently. An ad set with a $8 CPR and one with a $40 CPR averaged together produce a $24 campaign CPR that describes neither ad set accurately.
What to do with it: compare CPR against your target CPA or the economics of your offer. Above target? Find which ad sets are pulling the average up and pause or adjust them. Below target? See if you can scale.
ROAS (Return on Ad Spend)
ROAS – revenue divided by ad spend – is the metric that matters for ecom. A ROAS of 3 means $3 back for every $1 spent.
Same caveat as CPR in 2026: Meta’s reported ROAS includes modeled conversions. Cross-reference with your backend revenue data before making scale decisions based on Meta-reported ROAS alone.
Also track ROAS at the ad level. Creative is your primary lever in Advantage+ and broad-targeting campaigns. Knowing which creatives are generating the highest ROAS tells you where to put more budget and what to use as the brief for new creative generation.
Hook Rate
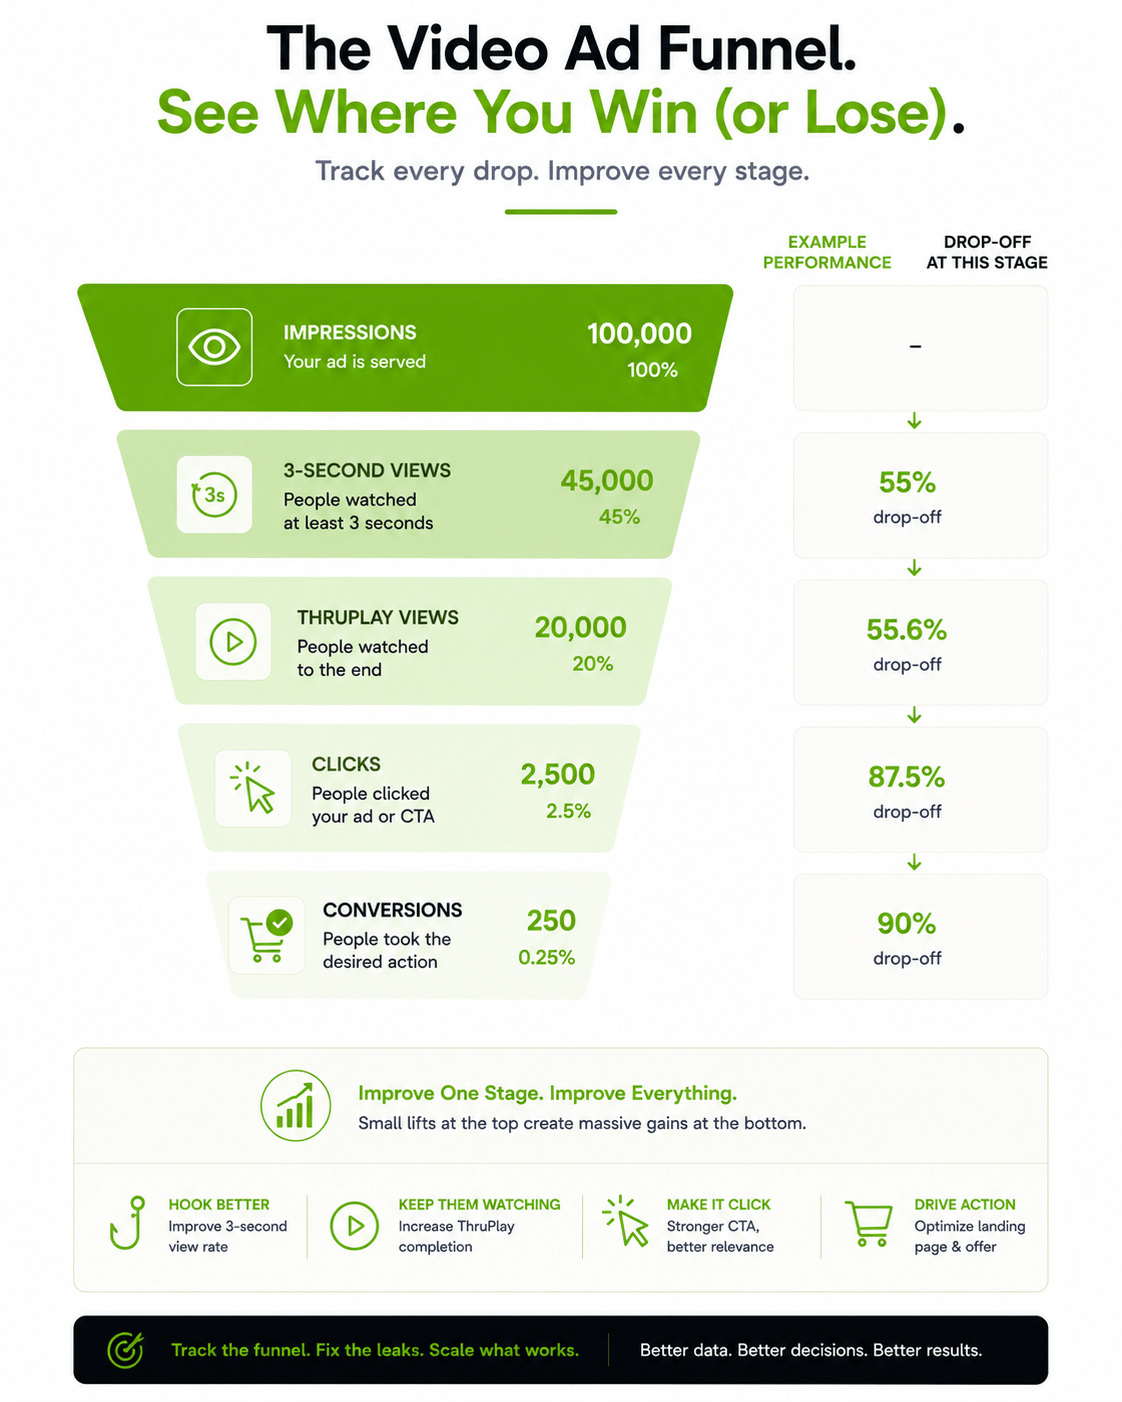
Hook rate is the percentage of people who watch at least 3 seconds of a video ad after it starts playing.
This metric doesn’t appear by default in Facebook ads analytics. You need to add it as a custom column using ThruPlay or 3-second video views divided by impressions.
Why it matters: hook rate is the earliest signal of creative quality. A low hook rate means people are scrolling past in the first 3 seconds – the ad isn’t stopping them. A high hook rate with low conversion rate means the hook is working but the rest of the creative isn’t. These are two different problems with two different fixes.
Frequency
Frequency is the average number of times someone in your target audience has seen your ad.
High frequency (above 3-4 for most campaigns) is the earliest warning sign of creative fatigue. When frequency climbs and performance drops simultaneously, the creative is saturating – the audience has seen it enough that it’s stopped registering.
Don’t wait for CPR to spike before checking frequency. Watch it alongside your other metrics and refresh creative before frequency hits the warning zone.
CPM (Cost Per 1,000 Impressions)
CPM is what Meta charges you to reach your audience. It moves with auction competition, audience size, placement, and creative quality.
If CPM rises but conversion rate holds steady, that’s fine – you’re paying more for traffic that still converts. If CPM rises and conversion rate drops too, that’s worth digging into. Could be audience saturation, could be seasonal competition, could be Meta’s algorithm flagging weaker creative.
Compare CPM against your own account history, not industry benchmarks. What matters is whether it’s moving the right way for your audience and placement mix.
Click-Through Rate (CTR)
CTR – the share of people who click after seeing the ad – measures relevance. A high CTR means the ad is compelling enough that people want to know more.
Track link CTR (clicks to your destination URL) rather than all CTR (which includes clicks on the post itself, reactions, profile clicks). Link CTR is the signal that maps to actual traffic and downstream conversion.
Low CTR with high CPM is often a creative problem – the ad is reaching people but not resonating. High CTR with low conversion rate is often a landing page problem – the ad is working but the destination isn’t.
The Metrics That Tell You What’s Happening at the Account Level
Beyond individual campaign metrics, a few account-level signals are worth monitoring regularly.
Account-level CPR trend – is cost per result climbing or dropping over the last 30-60 days? If it’s rising across the whole account, not just one campaign, that’s audience saturation, more competition, or creative gone stale. Fix it at the account level.
Spend vs. budget utilization – are campaigns spending what they’re allotted, or sitting on unused budget? Consistent underspend usually means the audience is too small or narrow for the budget, or the bid strategy needs a look.
Top creative performance distribution – what percentage of your total spend is going to your top 3 creatives? Heavy concentration in 2-3 creatives with the rest underperforming is a signal to build on what’s working rather than running a long tail of mediocre creatives.
How FabFunnel’s Reporting Fits In
Managing facebook advertising analytics across multiple accounts – as agencies and larger performance teams do – creates a dashboard problem. Each ad account has its own Ads Manager. Comparing performance across clients or campaigns requires switching between accounts, exporting data, and reconciling it manually.
FabFunnel‘s multi-ad account reporting consolidates performance data across Meta, TikTok, and NewsBreak accounts into a single view. For teams managing several accounts, this replaces the manual reconciliation process and makes account-level trend monitoring practical rather than time-consuming.
The Takeaway: Facebook Ads Analytics Is Only Useful If It Drives Action
Data for its own sake doesn’t improve campaign performance. The metric framework that works in practice is simple – track the six core metrics consistently, define what each one should be telling you, and build a response protocol for when each one moves in the wrong direction.
When CPR rises, check frequency first. When hook rate is low, check creative. When CTR is high but conversion is low, check the landing page. When ROAS drops, cross-reference with backend data before drawing conclusions.
The teams getting the most from facebook ads analytics in 2026 aren’t the ones with the most data. They’re the ones who know exactly which number to look at and what to do when it changes.
Frequently Asked Questions
What are the most important Facebook ads analytics metrics?
Cost per result, ROAS (for ecom), hook rate (for video), frequency, CPM, and link CTR. These six cover creative performance, audience health, and budget efficiency – the three dimensions that drive most optimization decisions.
How do I track hook rate in Facebook Ads Manager?
Add a custom column: 3-second video views divided by impressions, times 100. In Ads Manager go to Columns, then Customize Columns, search “3-second video plays,” and drop it in next to your usual metrics.
How does iOS affect Facebook ads analytics accuracy?
iOS cut off a lot of individual tracking, so Meta now fills gaps with modeled conversions mixed in with confirmed ones. Treat the numbers as a rough read, not a precise count. If real budget is on the line, check it against backend data – Shopify, your CRM, whatever’s processing the payments.
What frequency level should trigger a creative refresh?
3-4 is the general warning zone for most campaigns, but this varies by audience size and spend level. Smaller audiences saturate faster. Monitor the combination of rising frequency and declining CPR together – that pattern is a clearer signal than frequency alone.
What does a high CPM mean for my Facebook campaign?
High CPM relative to your account average means Meta is charging more to reach your audience – either because auction competition has increased, your audience is smaller and more competitive, or your creative quality score has dropped. Diagnose by checking if CPM has risen across the account or just in specific campaigns.
How is Facebook ads analytics different from Google Analytics for paid campaigns?
Facebook Ads Manager covers the ad side: impressions, clicks, Meta-attributed conversions. Google Analytics picks up from the click – what happens on your site after. Use both and you’re not missing either half. The conversion counts usually won’t match, though – different attribution models, not an error.