Quick Answer
Published Meta ads benchmarks vary widely by source, industry vertical, and time period, so this piece won’t state a specific CPA, CTR, or ROAS figure as a fixed target — a benchmark quoted today is likely to be stale or contextually misleading within a quarter. The more reliable approach for a US ecommerce brand: track your own account’s rolling baseline over time, and use published industry benchmarks only as a rough sanity check, not a target to hit.
Every “Meta ads benchmarks” resource online quotes different numbers, and that’s not an accident — benchmark figures depend heavily on industry vertical, average order value, seasonality, and the specific date the data was pulled. A benchmark quoted for “ecommerce” broadly can be meaningless for a specific brand if that brand’s category, price point, or customer base looks nothing like the blended average behind the number.
Why Do Facebook Ads Benchmarks Vary So Much Between Sources?
Because they’re aggregated from different account samples, different verticals, and different time windows. A facebook advertising benchmarks report pulled from a broad panel of advertisers blends high-AOV and low-AOV brands, different seasons, and different levels of account maturity into one average — which is why the same metric can look completely different depending on which report you’re reading.
What Should a US Ecommerce Brand Track Instead of Fixed Meta Ads Benchmarks?
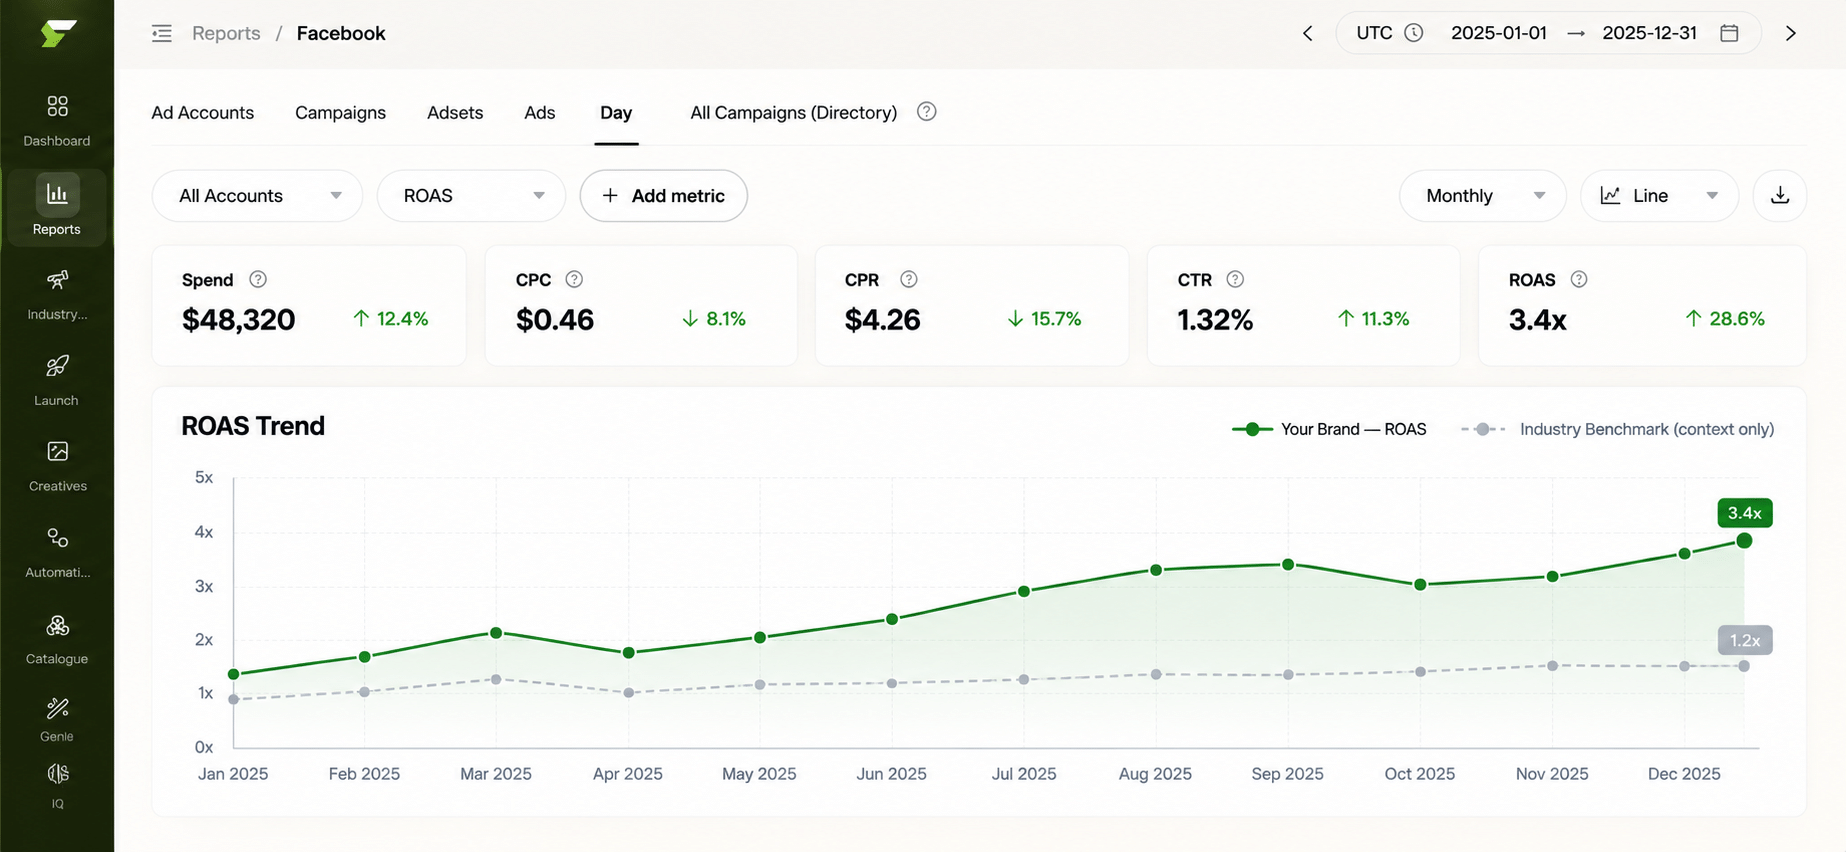
Your own account’s rolling baseline: average CPA, ROAS, and CTR over a trailing period (4-8 weeks is a reasonable window), tracked continuously rather than compared to a one-time published number. A facebook ad benchmark from an industry report tells you roughly where other accounts sit; your own trailing average tells you whether your account is improving, declining, or stable — which is the more actionable signal.
How Does Multi Ad Account Reporting Help Build Your Own Benchmark?
Multi Ad Account Reporting keeps spend, ROAS, CPR, CPC, and CTR synced roughly every 15 minutes across Meta, TikTok, and NewsBreak, with per-account timezone settings. Consistently synced data over time is what a real, account-specific benchmark is built from — a rolling view of your own numbers, not a single published industry figure treated as a target.
When Are Published Meta Ads Benchmarks Actually Useful?
As a rough sanity check, not a goal. If your account’s CPA is wildly out of line with even a broad industry range, that’s worth investigating — but “wildly out of line” is a low bar, and being close to a published average doesn’t mean your account is optimized. The more useful comparison is always your account against its own recent history.
Building Your Own Benchmark vs. Chasing Published Meta Ads Benchmarks
| Approach | What It Tells You | Risk |
|---|---|---|
| Published industry benchmark | Rough range other advertisers see, blended across accounts | Can be stale, blended across unlike accounts, or from a different period |
| Your own trailing average (4-8 weeks) | Whether your account is improving, stable, or declining | Requires consistent tracking to be meaningful |
| Comparing to last year, same season | Accounts for seasonality specific to your business | Less useful if your account or catalogue has changed significantly since |
Does Benchmarking Against Competitors Work Better Than Industry Averages?
It can be more relevant than a broad industry blend, since it’s closer to your actual competitive set, but it comes with the same caveat: you’re seeing their creative and messaging, not their underlying account economics. FabFunnel’s Industry Insights lets you browse competitor Meta ad activity by vertical, which is useful for creative and positioning comparison — a different, complementary exercise to tracking your own performance benchmark.
What Is the One Benchmark That Matters More Than Any Published Figure?
Break-even ROAS. It comes from your own margins, not from an industry report. The calculation is simple: divide 1 by your gross margin as a decimal. A product with a 50% gross margin breaks even at a ROAS of 2.0; at 40%, break-even is 2.5. Any ROAS above that number is contributing to profit, and any ROAS below it is losing money on ad spend alone, regardless of what a published average says.
This is why two brands can see the same meta ads benchmarks and need completely different results. A brand with thin margins needs a much higher ROAS to be healthy than a brand with high margins. Set your break-even first, then judge every campaign against it.
How Do You Build a Benchmark Sheet From Your Own Account?
Keep it simple enough that someone will actually update it:
- Pick four or five metrics. CPA or cost per result, ROAS, CTR, CPC, and frequency are usually enough.
- Record weekly, not daily. Daily numbers are noisy, especially at lower spend.
- Use a trailing 4–8 week average as the reference line, and note the date range.
- Add the same-season comparison from last year where you have it.
- Annotate changes. Note price changes, new product launches, sales, and tracking changes, because these explain most of the movement.
Consolidated, regularly synced reporting makes step 2 much less manual. Once you have eight or more weeks of data, you have a benchmark that is specific to your account, which is what published facebook ad benchmarks can never be.
How Should You Present Meta Ads Benchmarks to Leadership or Clients?
Be upfront that Meta ads benchmarks are context, not targets. When a stakeholder asks whether your cost per result is “good,” show three things side by side: your own figure for the last 90 days, the same period a year earlier, and the published range with its source and date. That framing answers the question without pretending a single average applies to your business.
Name the limits of the data too. Say which industry vertical the report covers, how large the sample was, and whether it was measured on the same attribution settings as your account. If you cannot find those details, treat the Meta ads benchmarks as a rough guide at best.
Finally, turn the comparison into a decision. If your numbers sit below a published range but above your own margin-based break-even, nothing needs fixing. If they sit inside the range but below break-even, the benchmark is not protecting you, and the account still needs work.
FAQs
What’s a good Meta ads benchmark for a US ecommerce brand to aim for?
There isn’t a single reliable number to quote here — published benchmarks vary too much by vertical, AOV, and time period to serve as a fixed target. Your own account’s trailing average, tracked over time, is the more useful reference point.
Why do different facebook ads benchmarks reports show different numbers for the same metric?
Different data samples, different industry mixes, and different time windows. A benchmark aggregated across broad ecommerce is not directly comparable to your specific vertical or price point.
How often should I check my account against a facebook ad benchmark?
Less often than you’d think — a monthly or quarterly check against a broad published range is enough for a sanity check. Your own trailing performance is worth tracking continuously, which is what automated reporting is for.
Is benchmark facebook ads data more useful at the campaign level or account level?
Account-level trends are generally more stable and useful for benchmarking; individual campaign numbers can be noisy day to day, especially at lower spend or conversion volumes. The same applies whether you’re looking at facebook ad benchmarks for one campaign or a blended account-level figure.
Should I trust a facebook advertising benchmarks report from a single vendor?
Treat any single source as one data point, not ground truth — cross-reference a few sources if you’re using published benchmarks at all, and weight your own account history more heavily than any of them.
Can small brands use Meta ads benchmarks at all?
Yes, as a sanity check. A small account has too little data for tight comparisons, so use Meta ads benchmarks to spot extreme gaps, then rely on your own weekly trend for decisions.
Does seasonality make Meta ads benchmarks less useful?
It makes point-in-time benchmarks less useful and makes comparing your account to its own same-season history from a prior year more useful, since that comparison accounts for seasonality your business actually experiences.
Where to Start
If you’ve been chasing published Meta ads benchmarks instead of tracking your own account’s trend, that’s the shift worth making. FabFunnel’s Multi Ad Account Reporting keeps your own spend, ROAS, CPR, CPC, and CTR data current so you can build a real, account-specific baseline — start at FabFunnel or explore the full toolset at Fab AI.